 Pontbot
 How to Create a Compelling Comparison?
If you look at any research topic, in many cases they compare things.
When you go into a store, you do exactly the same thing - you compare products to each other.
How many grams of chocolate cookies do I get for this money? Oh, the other one has Oreo pieces too, and costs the same, so I'll buy this one.
 Moreover, it's almost certain that at least once in your life you've compared your ex to your current partner (if you have one, but now focus on your thesis!).
You want to know which one is better, stronger, faster, more efficient, tastier, etc., according to your decision or usage.
Good research is exactly about this - creating something new, better, more efficient, more informative. To innovate.
Remember the Keyword - Question - Answer article where we created some questions?
- What potentially negative or positive effects could this type of posture have?
- How do treatment methods differ? Why is one better than the other?
These questions exactly touch on the topic of Comparison.
For example, if you have a questionnaire that you collected from a quantitative research, what do you do with it?
The Good Old Charts
People almost love infographics.
Look at the following infographic, it's almost full of information:
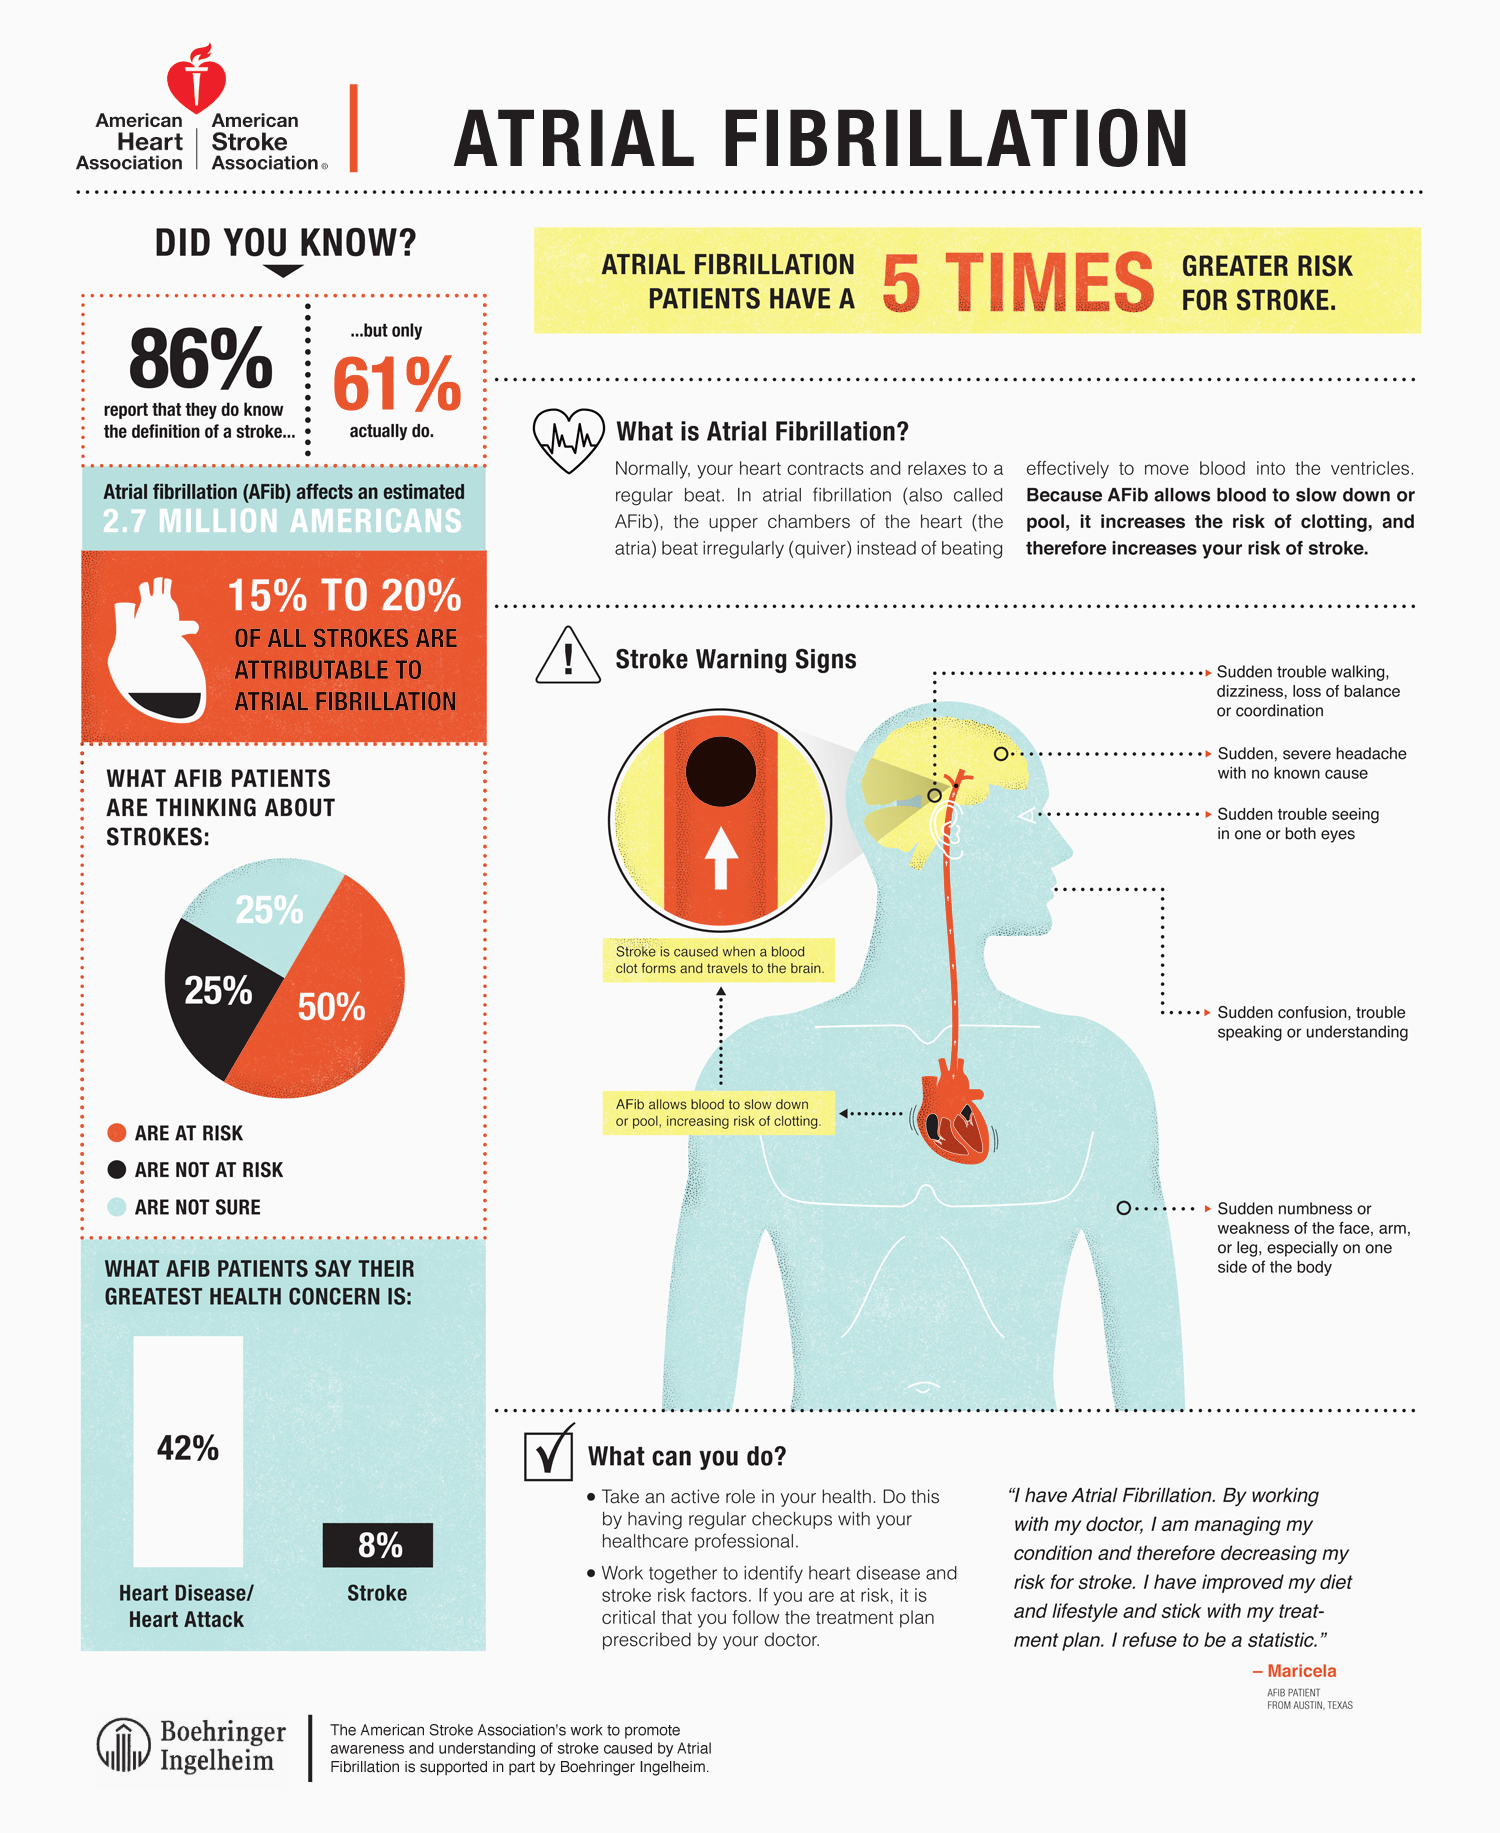
I'll honestly admit that I haven't seen such a format presented in a university thesis yet - there, the old-fashioned tables and pie charts dominate.
Moreover, if you look at a company presentation, this habit comes through nicely.
But this template is exactly good because you can highlight pieces from it, and then you can describe the content of that chart at length:
- where it came from,
- what the pattern is,
- from what data,
- from whose data,
- when is the data from, how much has it changed compared to now?
Tables, Oh Yes
A well constructed table, with comparison + detailed description can add 2-3 pages extra. (some universities don't count the table, but they do count the detailed description below it) 😉
I'll give you an example, but don't laugh at me (my quantitative, qualitative table was something like this too if you were paying attention 😉):
| Properties | Chocolate | Oreo Chocolate |
|---|---|---|
| How many grams? | 100 | 125 |
| Contains OREO pieces | Yes | No |
| Number of pieces | 1 | 3 |
| Diameter size | 25 | 30 |
| Price | 100 Ft | 120 Ft |
This is already an achieved result. The different information you collected is compared to each other, from which you draw conclusions.
From this, you can generate the following sentence: "During the data collection of Chocolate and Oreo chocolate, I created the following comparative table. The table includes the following properties: how many grams, whether it contains Oreo pieces, number of chocolate pieces, diameter size, the chocolate's market price. During price determination, I took into account the pricing logic found in retail. I extracted the prices from the corner store's database."
"Examining the data, it's clearly visible that Oreo chocolate has 25% more content. This is also thanks to containing OREO pieces. For countless consumers, this can result in a strong purchasing advantage. Furthermore, it also contains more chocolate pieces, exactly 3x as many. Thanks to this, its diameter is also larger, however, the 20 Ft extra price doesn't deter consumers from buying Oreo chocolate. As proof of this, I conducted primary research, I asked 1000 people whether they would rather buy OREO chocolate or plain chocolate. From the data... blablablabla"
We've written the above text, great.
But is this definitely good for my thesis? Let's see in the next article, what kind of language should be used in the thesis